YouTube Studio is well-known for providing a wealth of data to help users understand performance trends across their content. But the truth is that most users barely scratch the surface of what benefits this tool can bring to their YouTube channel analytics by ignoring its advanced mode display.
Whether you run a video podcast, upload unboxings and reviews, or use your channel as an explainer video portfolio like us, YouTube Analytics’ Advanced Mode provides a suite of features that help you access vital data you can’t get anywhere else on the platform. Including invaluable metrics on how people discover your content, consumer insights, preferences, and even what is and isn't working with your videos!
So today, we are going over the platform's advanced mode reporting tools, what they bring to the analytics table, and a few ways in which you can leverage this information to get a better grasp on your content's performance.
Understanding the Purpose of YouTube Analytics Advanced Mode
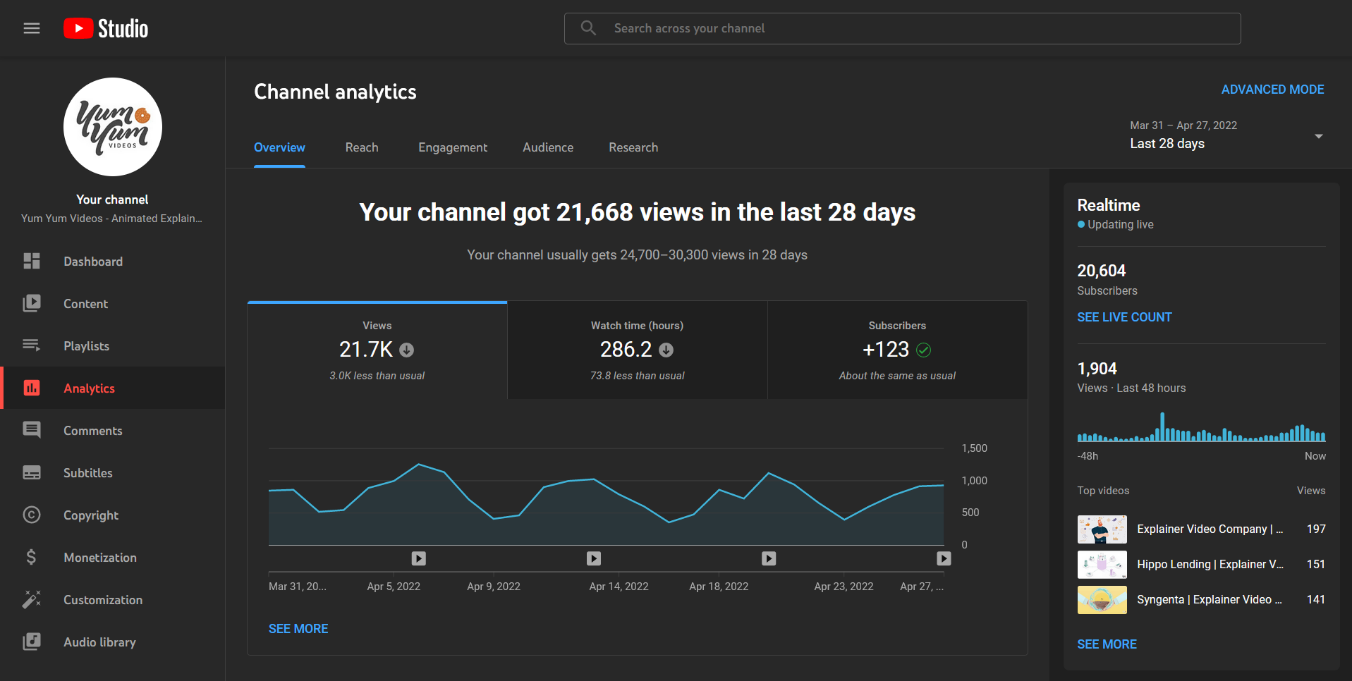
The first thing worth mentioning here is that the YouTube Analytics default display does a great job at quickly and easily conveying some of the most relevant channel performance metrics you need to be aware of.
With just a click, you get to visualize an overview of your channel’s views, watch time, and subscriber numbers, and a couple of clicks more can give you similar reports on your channel's reach, engagement, and audience.
However, the problem isn't so much what these reports show you but rather what they leave out.
To maintain an easy-to-read, visually-rich interface, the default YouTube Analytics view focuses on just a handful of critical aspects of your channel, leaving out a lot of data that, while extremely useful, might be intimidating if served upfront to the average user.
That’s what Advanced Mode is all about.
YouTube Analytics Advanced Mode — accessed by clicking the Advanced Mode link in the top right of your default analytics view — gives you access to a host of display, grouping, filtering, and comparison features that not only give you a more in-depth look at your channel and content's performance but also help you organize and analyze this data to gain practical insights from it.
So, let's start by taking a closer look at how these different tools work and the valuable metrics they provide according to YouTube experts.
YouTube Analytics Advanced Mode: Configuring, Filtering, and Display Features
Leveraging Advanced Mode display is all about knowing how to configure the tool to show the data you are interested in and then refining those reports through filters that help you visualize data and patterns you can use.
Configuring Advanced Mode
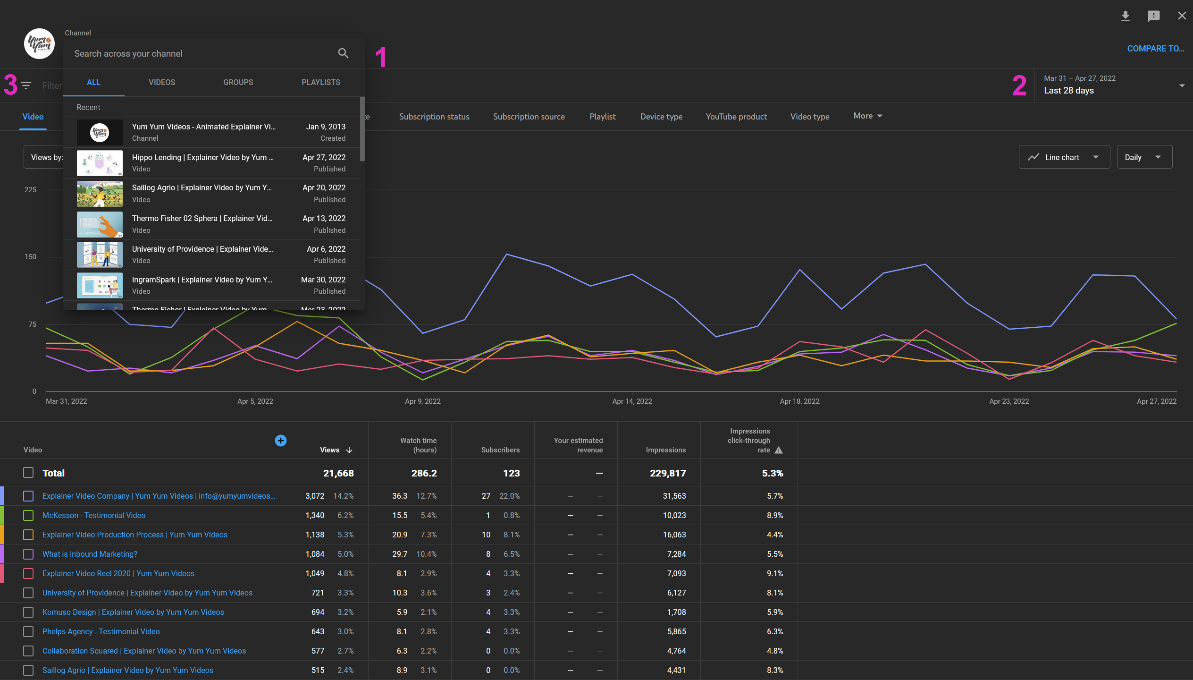
The first thing you’ll want to do when you access it is to ensure you configure the tool to display the type of content and ranges you want to analyze using the Search Bar (1), Date Range (2), and Filter (3).
Search Bar
By default, YouTube Analytics Advanced Mode will display general data relating to your whole channel, which gives you a quick way to gauge your channel’s overall health and performance metrics. However, the search bar also lets you configure the type of data you’ll be working with in three meaningful ways:
- Videos: show you data on a video-by-video basis, which will be the go-to configuration for getting into the nitty-gritty of individual videos' performance.
- Groups: let you group up your content according to the parameters you want to study in detail. It’s perfect for analyzing how different types of videos perform on your channel. Maybe you want to know if your short videos generate more engagement than longer ones or if your subscribers prefer watching your in-depth How-to guides or animated explainer videos. Groups give you the perfect way to focus your analysis where you want it when looking into multiple pieces of content.
- Playlists: very similar to Groups, playlist configure your Advanced Mode display to work with whichever videos you have already grouped by creating playlists for your channel's content. Depending on how much time you've invested in creating and using YouTube playlists, this might be a better alternative than building and configuring groups from scratch.
Date Range
By default, YouTube Analytics breaks down your data from the past 28 days. However, this is hardly useful if you are trying to get a better sense of your content's long-term performance.
The Date Range configuration tool lets you switch to display data from specific timeframes, like the past three months, the past year, and even the lifetime of your channel. You can also directly configure your display to show data about a specific year, which can be helpful when you want to do year-over-year comparisons and analyses.
Filter
By and large, this unassuming feature gives you your first true taste of the power and range this powerful analytics tool can provide.
With just a click, you can immediately configure Advanced Mode to display data around key YouTube Analytics metrics and dimensions that can give you deeper insights on how people are engaging with your videos, including (but not limited to): Audio only playbacks, live/on-demand plays, operating system, traffic source, and the YouTube Product viewers use to watch your content.
Note that some of these configuration parameters will also be available for use as you manually tweak your analytics display – which we'll talk about this in a bit more detail later on. But for now, know that the Filter option gives you a quick way to study your video’s analytics using these parameters with ease.
Main Filtering and Display Features for Advanced Mode
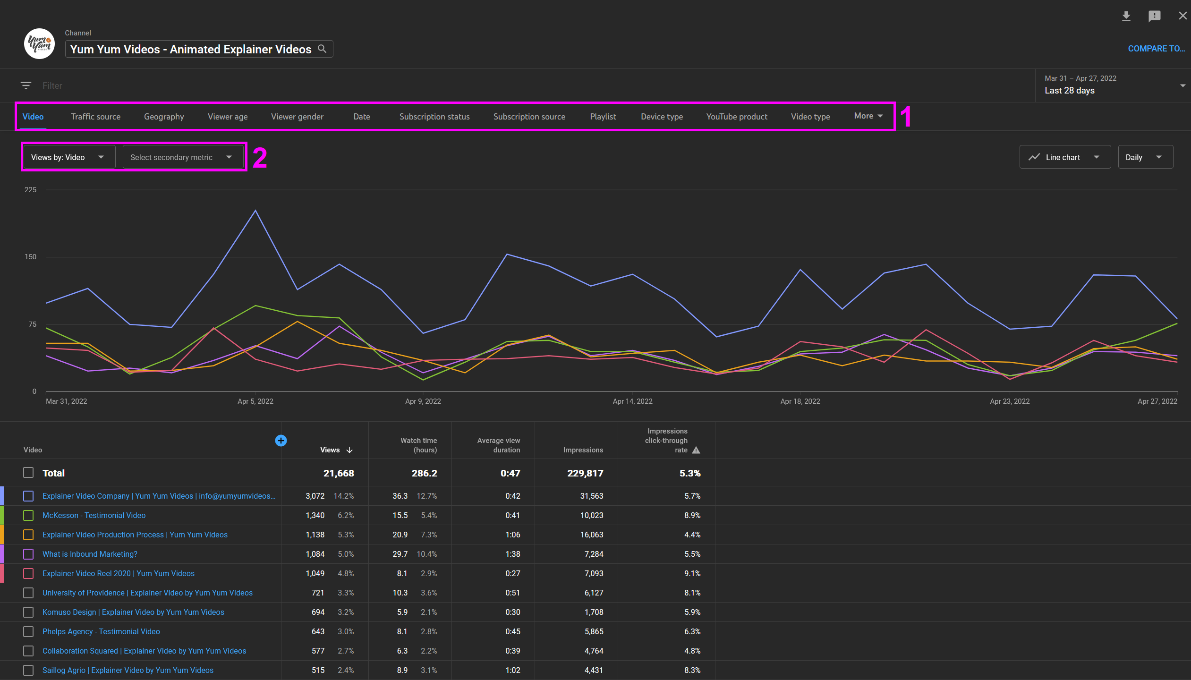
Once you’ve configured YouTube Analytics to work with the type of data and ranges you are interested in breaking down, you can start playing around with the main display and filtering features that make Advanced Mode such a robust analytics and reporting tool, located right above the graphics display.
These represent your primary tool to access the YouTube Analytics metrics and stats you are looking for.
The top row (1) offers you over 20 different dimensions you can use here to further break down the information you’ll be working with. The dropdown lists (2) let you change the metric you are displaying in the chart and choose a secondary metric to look at. Do also note that the chart itself is interactive, so you can hover over any part of the chart to get even more detailed information.
Each filter within these sections will be more or less relevant to you, depending on the specifics of your strategy and the type of insights you are looking for. However, you might want to pay attention to some essential filtering options from the get-go, as they display data relevant to most channels or metrics you can't access anywhere else on the platform.
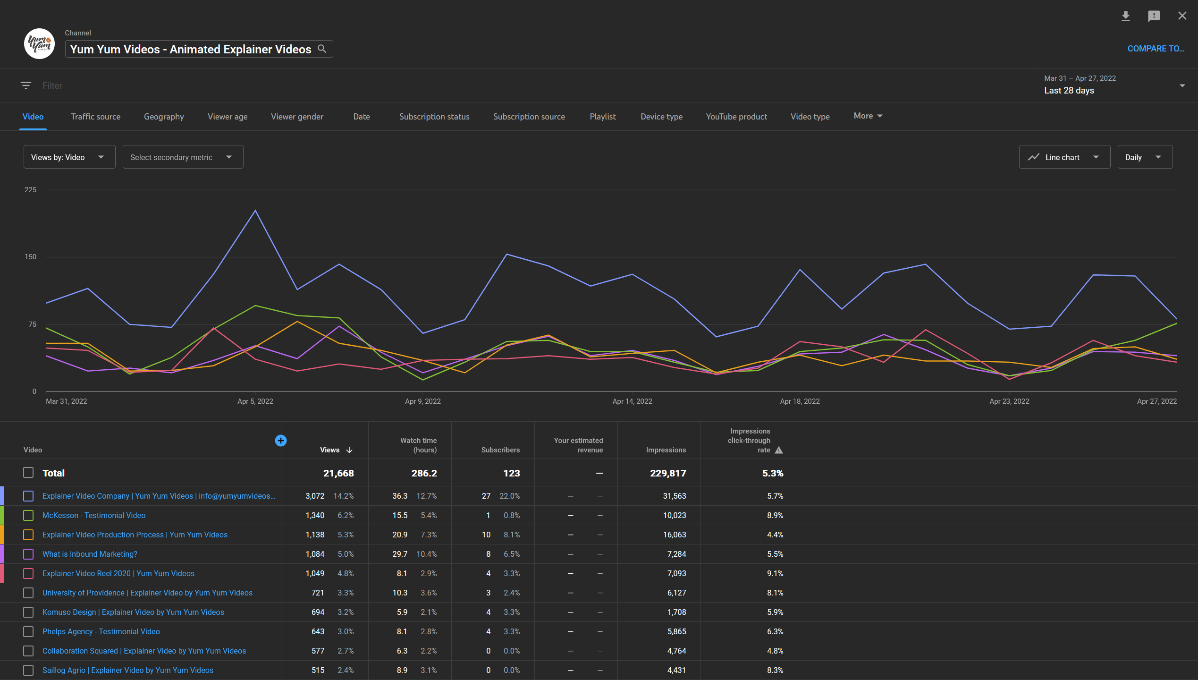
Video
This is your default display and shows the number of views the top 5 videos on your channels have received within the Date Range you selected. At a glance, it tells you the sort of content the bulk of your audience seems most interested in and can be combined with metrics like Watch Time or Average View Duration in the dropdown lists to help you dissect in detail how people respond to your content.
Traffic Sources
Alongside Video, Traffic Sources quickly deliver vital data you always want to be aware of: it tells you where people that watch your videos are coming from. This display option can help you gauge how effective any given outreach and engagement strategy you are executing is turning out to be. Moreover, you can combine this display with Impressions and Impressions Click-through Rate to gain even more insights into how people respond to your channel's content and whether or not they decide to watch more once they find you.
Demographic Filters
The next few options on the menu all have to do with your audience’s demographic: Geography, Viewer Age, Viewer Gender. These data points can help you understand your audience and, combined with their preferences and viewing patterns, can help you refine and improve your content to help your channel grow. Additionally, you can combine this data with interaction metrics such as Subscribers Gained/Lost and Likes to get a breakdown of how these different demographics interact with your content beyond viewing it, providing further understanding of trends and tastes.
Subscription Source
As the name suggests, this display option focuses on the parts of your channel that generate subscriptions — both gained and lost — within your selected date range. Subscriptions are a core metric you need to nurture to ensure the long-term health and growth of your YouTube presence. Understanding in detail the areas of your channel that prompt people to subscribe (or unsubscribe) can make a world of difference in your efforts to grow on the platform. You can further filter this display with metrics like End Screen Elements Shown and Card Shown to find patterns and see how these elements are helping (or hindering) your efforts to get viewers to subscribe.
Device Type
This data display option simply tells you the kind of devices viewers use to watch your content. It is a simple thing, but combined with data points like Views and Average Percentage Viewed, this Advanced Mode section can (and arguably should) inform your content production strategy. Ideally, you want to tweak and optimize your content to provide the best possible viewing experience for the bulk of your audience. That'll look very differently whether you are optimizing for a primarily desktop audience or mobile viewers.
Sharing Service
Hidden behind the “More” button at the end of the top row (1), this display option can give you many details on how your viewers are sharing your videos. Whether they copy your video's links to the clipboard, embed it, or use platforms like WhatsApp or social media channels to pass your content along. This data can tell you a great deal about the type of content that motivates people to share your videos and the platforms they use to do so, and Advanced Mode gives you the only way to access it!
Getting the Most Out of Your Advanced Mode’s Reporting Tools
Needless to say, in-depth data analytic tools give you a multitude of ways to tweak, refine, and customize what you see on-screen, and YouTube Analytics' Advanced Mode is no exception. And while we'd need an entire book to cover every way you can customize your Advanced Mode reporting and display experience, here are a few core tools and functions you’ll want to start using right away.
Creating and using groups:
Groups represent an ideal midpoint between analyzing your channel's metrics as a whole and doing so individually on a video-by-video basis. Most videos on your channel are bound to be related to the rest in more than one dimension — topic, length, upload time — and this aptly named tool lets you group up similar videos for further analysis.
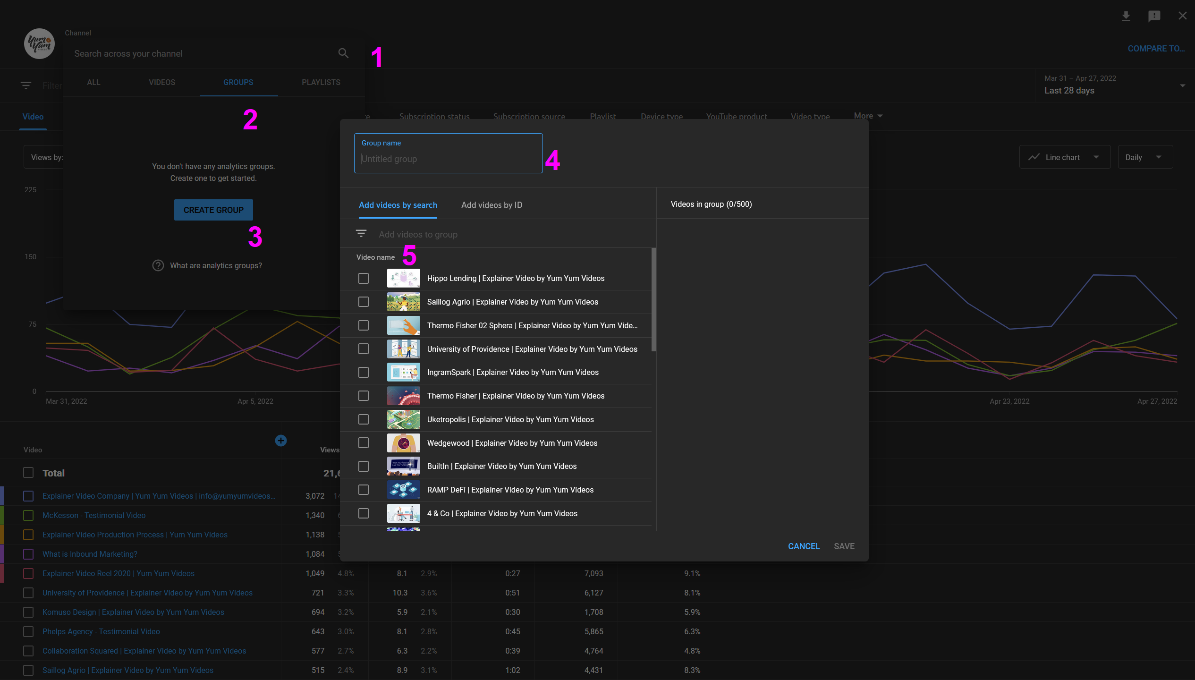
To create a new group, click on your Advanced Mode’s Search Bar (1) > then Groups (2) > and then the Create Group button (3). A new window will emerge where you can input a Group Name — always make sure this is descriptive and quickly tells you the type of videos included — and a list for you to select the videos you want to include.
Groups give you the perfect way to categorize, analyze, and compare metrics from collections of your videos as a unit, which makes it easier to detect patterns and performance differences between types of content that you can use to inform your strategy on the platform.
Understanding and customizing your reporting tables:
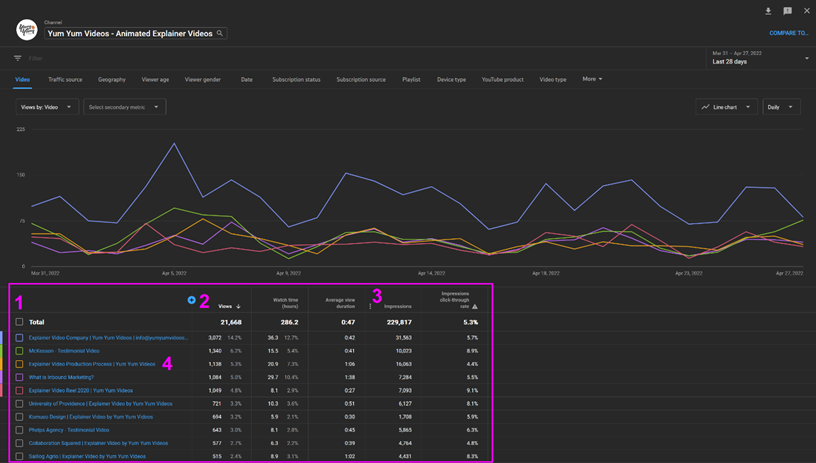
Reporting tables are the spreadsheets you see right below the chart in your YouTube Analytics Advanced Mode display. This table is meant to give you further details and breakdowns of your data, and there are a couple of interesting ways in which you can customize it to serve your needs.
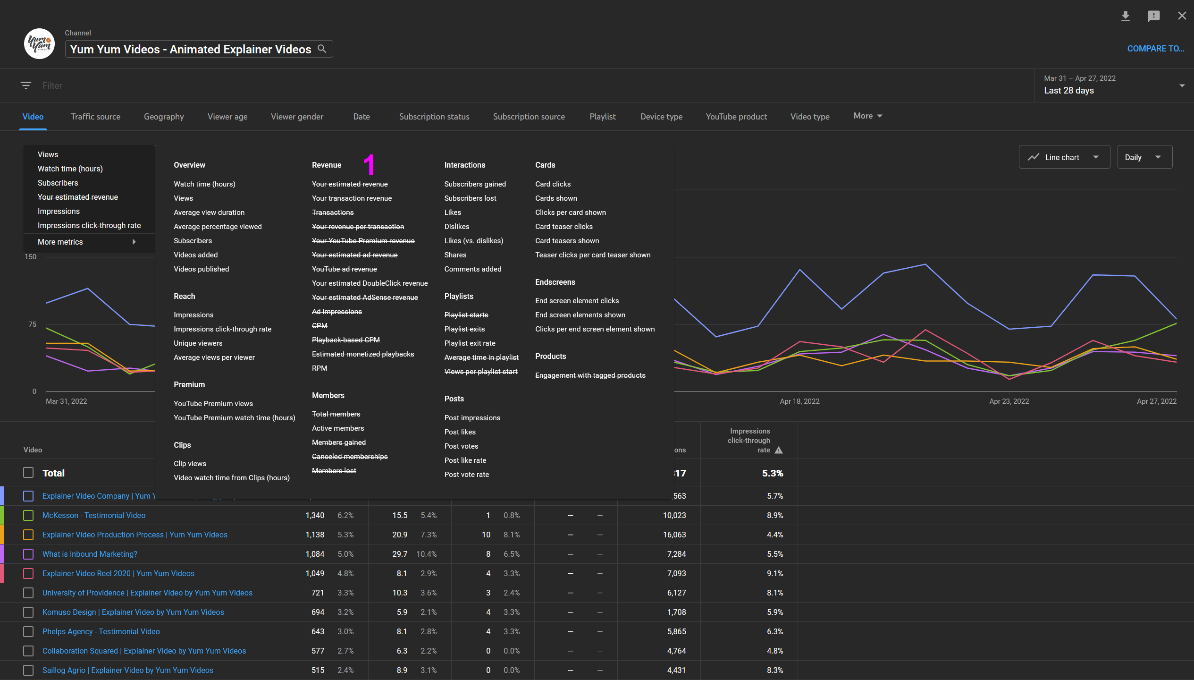
Checking the box next to each individual row (1) changes the data your chart displays; every item you check will have a corresponding bar or line on the chart. You can also click the blue plus sign (2) to add a metric to your table — which opens up the same metrics window you could access by clicking “More Metrics” in the dropdown list above the chart. To remove metrics from your table, just click the three-dot option button (3) on any column’s name and select “Hide Metric”. Lastly, you can click on rows written in blue text (4) to get even more detailed data on that specific entry.
Taking the time to customize your reporting tables will directly influence how quickly and efficiently you can visualize data on Advanced Mode, ensuring you are only shown things that are relevant to the aspects of your channel you are trying to understand and improving your overall experience with the tool.Use the compare tool for further insights:
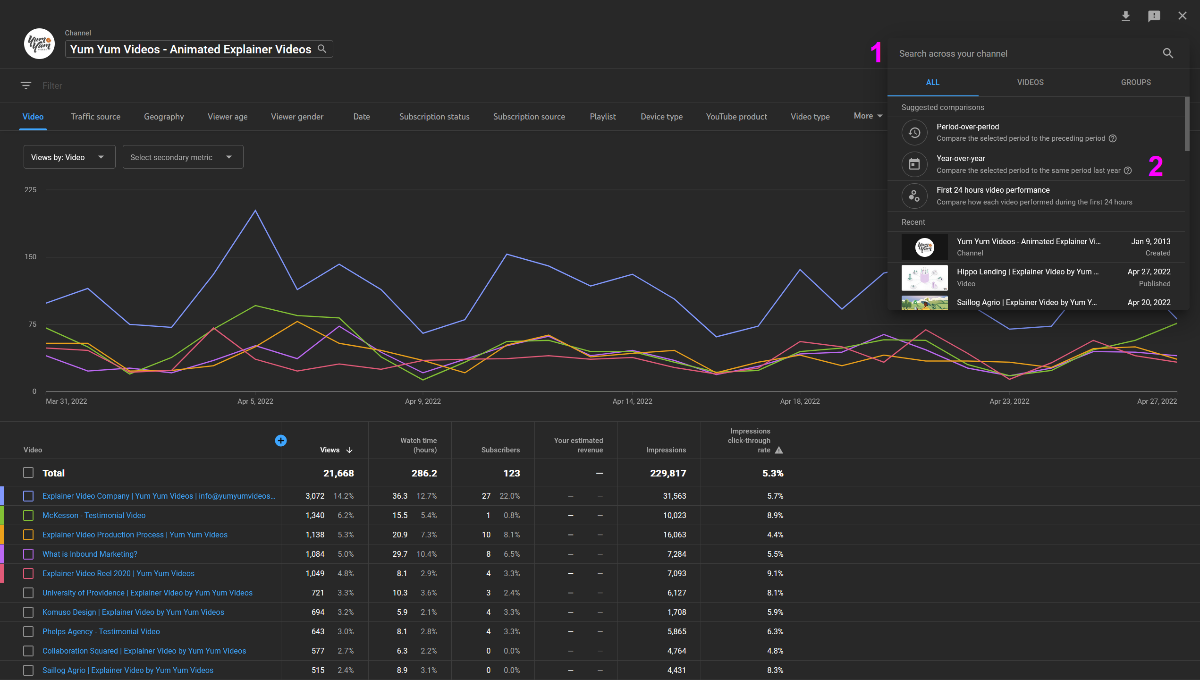
Once you are familiar with how Groups and display tables work on the Advanced Mode UI, you’ll want to use the compare feature to analyze related entries. To access it, just click on the “Compare To…” blue text at the top right of your YouTube Analytics Advanced Mode display.
Doing so opens a small window (1) with all the options you need to find the other pieces of content you wish to compare to the one you are working on. You select some of the suggested comparisons (2) for your typical year-over-year or period-over-period analysis, or you can look for individual videos and/or groups.
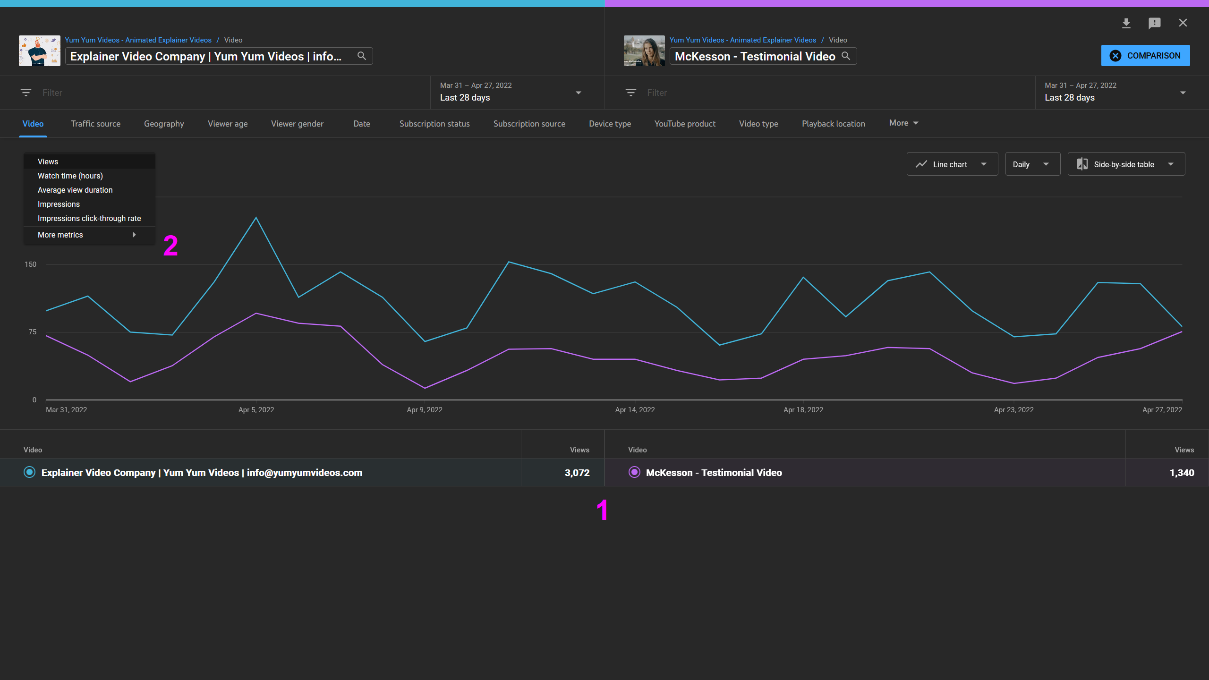
Once inside the compare tool, your reporting table gets replaced with a list of the items being compared (1). However, know that you can still change the data being displayed/compared with the same menu at the top and further tweak the metrics being shown by clicking the visualization option you are using and then clicking “More metrics” in the small emerging window.
Unavailable Metrics
As you start working with YouTube Analytics’ Advanced Mode, you’ll notice some data points aren’t available for visualization, and that can occur for a couple of reasons.
Sometimes, some data combinations are not supported for display, depending on what you are trying to look at. The metrics that appear crossed out on the menu aren't really compatible with the type of report or data you are working with. As you change these elements, some previously unavailable metrics might become available once more.
Other times, crossed-out metrics refer to data that doesn't exist for your channel. For example, since we don't monetize our content on the platform, all the Revenue metrics appear crossed out for our channel.
As you get more familiar with Advanced Mode, you’ll start getting a better sense of exactly when and where some of these data points become available, allowing you to further explore your channel’s metrics in depth.
Backing up and exporting your data
Last — but certainly not least — YouTube Analytics’ Advanced Mode makes it really easy to back up and export your data.
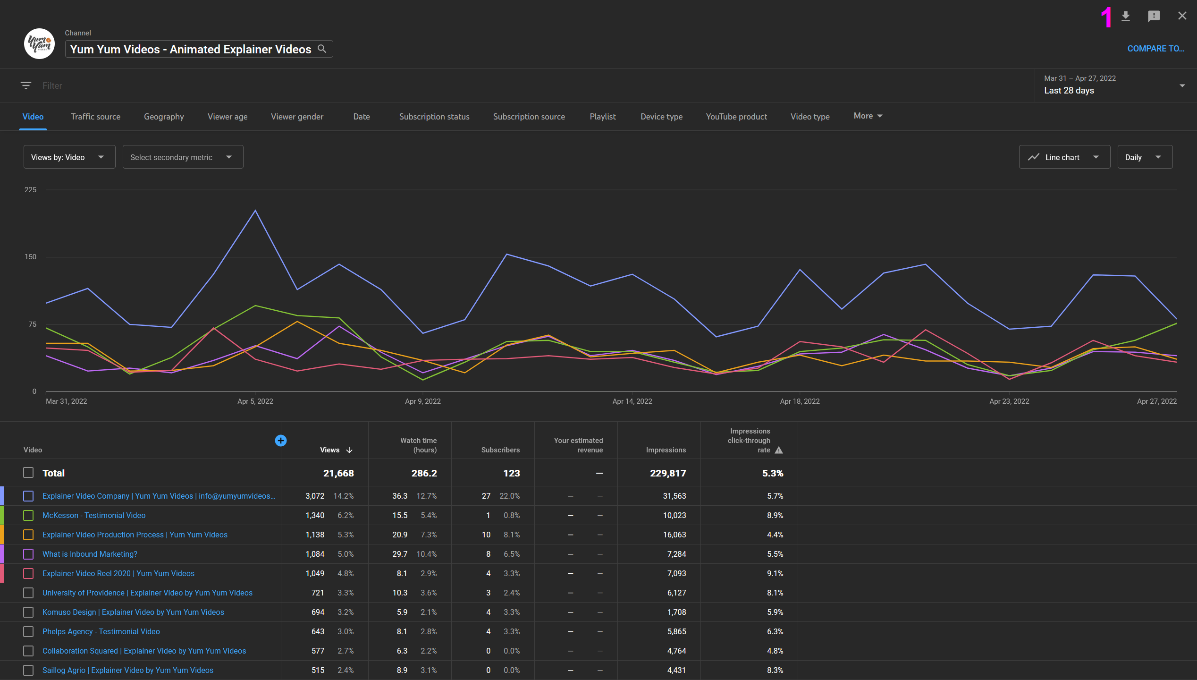
Simply click on the download arrow icon at the top right corner of your Advanced Mode display, and it will give you the options to open it up in a new tab on Google Sheets or download a .csv file.
It is worth noting that this feature isn’t just useful as a security measure!
When working on YouTube Studio, Advanced Mode is limited to displaying up to 50 rows of data within your reporting tables. However, a downloaded report includes up to 500 rows of data.
Wrapping Up
As you can see, Google believes in empowering its users with the data and analytics they need to make the most out of popular services like YouTube. But this data is only helpful if you learn how to access, interpret, and leverage it to your advantage!
Hopefully, after reading this far, you now have a much more solid understanding of what a tool like YouTube Analytics Advanced Mode can do for your content strategy, and you are ready to start digging for deeper insights that help you improve your ROMI on the platform.
So, what are you waiting for?
Time to start digging into your channel's advanced analytics and discovering for yourself the power that accurate, in-depth data can offer 😉
500+ data sources under one roof to drive business growth. 👇
.png)
 (1).png)
.png)

.png)



 (1).png)

.png)


.png)


.png)
.png)
