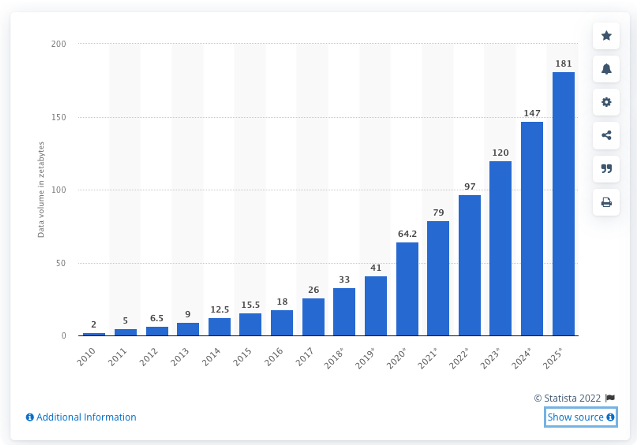
In today’s technology-driven economy, data storage has become more complex than ever. According to the IDC (International Data Corporation), 175 Zettabytes of data will be generated in 2025, representing almost three times the amount generated in 2021 (61 Zettabytes).
The volume of data created, captured, copied, and consumed worldwide from 2010 to 2025 from Statista
If you want to store and manage your company’s information correctly, you need to understand the many available options and how they can be integrated together.
Fortunately, this guide will help you build a modern data stack that allows you to collect, store, analyze, and ultimately make use of your data in the most effective way possible. This blueprint is flexible enough to be used by companies at any stage of development, no matter their size or industry type.
Why do you need a modern data stack?
A modern data stack is an integrated set of tools for handling the end-to-end lifecycle of data. It is designed to collect, process, and activate information in real-time. It’s essential for any organization that wants to understand trends at the granular level (e.g., within a client’s organization) and act on them before they are permanently set in stone.
Creating a modern data stack isn’t hard, but it does require some time and commitment and an understanding of exactly what you need from your data. If you’re serious about improving operations and gaining insights into your customers, it’ll be worth every minute of effort. The trick is knowing where to start and how to move forward.
The rest of this guide will give you all the information you need to create a modern data stack. You’ll learn how different components work together, and how to choose software for each part of your modern data stack. Once you finish reading, you’ll have everything you need to get started building a modern data stack at your organization today!
“From a data perspective, data warehouse appliances are a true gold mine. Making it available to vertically integrated solutions is at the core of the idea of the industry cloud.”
Ashish Thusoo
Data Lakes And Data Warehouses: The Two Sides Of A Modern Cloud Data Platform
Benefits of a modern data stack
Why invest in a modern data stack? Here are some benefits:
- Easily extract and load your data in minutes to any destination.
- Analyze large amounts of unstructured data – documents, search results, various metrics, etc. – without resorting to writing custom scripts or creating ad hoc queries.
- Let any business team self-serve with operational, trusted, and up-to-date data in their own tools.
- Deploy innovations in your organization faster by integrating no-code tools for business teams
- Modern data stacks reduce data engineering overhead by eliminating the need to build and maintain a data pipeline.
Understand the current environment
The first step to designing any solution is understanding what you’re trying to fix. Step back and look at what current tools, processes, and procedures your organization is using now. Then ask yourself: Are they efficient? Is there room for improvement?
The modern data stack is all about efficiency, so if there are inefficiencies in your current process (and trust me, there are), that’s an area where you can streamline.
In some cases, it might be as simple as increasing collaboration between teams or updating your processes, but sometimes it could mean replacing outdated software or even introducing new technology into your environment.
Whatever it is, start by defining the exact problems you’re solving before moving forward with any design work. It will make implementation much easier down the road.
Identify business needs and goals
Before choosing a database for your business, you need to understand its data model, what kind of queries and reporting it'll need and who will be using it. Getting answers to these questions will also help your business start upfront planning(instead of making changes down the road).
One key question here is how big your data store needs to be. For example, in an OLAP (Online analytical processing) scenario, you'll have plenty of rows but little data in each one - but in an online transaction processing (OLTP) scenario, you'll have plenty of rows with huge amounts of data in each row requiring a lot more storage space. And then, there are Business Intelligence (BI) reporting needs that require even more space. For such cases, BigQuery is the perfect storage that can handle all three scenarios really well.
Another thing to think about is whether you want to use cloud or on-premise storage. Hence, if you've already invested in on-premise infrastructure, Google Cloud Platform may not be right for you.
Calculate scalability and performance
When choosing a cloud provider, it’s important to consider whether your application will scale and perform as expected over time.
Another crucial thing is to understand how your data will be protected in each environment (for example, data centers can experience natural disasters, power outages, or equipment failures).
As with all of these steps, doing research and asking questions are essential. Companies such as New Relic offer tools that can help you monitor your application performance and traffic.
Furthermore, organizations like Netflix have created open-source technologies designed specifically for modern applications running on public clouds. For example, Netflix developed Security Monkey, a software that helps to monitor and secure large AWS-based environments.
It’s worth digging into these technologies when evaluating cloud providers—this kind of knowledge comes from talking with engineers from different companies and understanding their experiences.
The components of a modern data stack
Data is a strategic asset. In order to make the most of it, you need to understand the various components making up a data stack and how they work together.
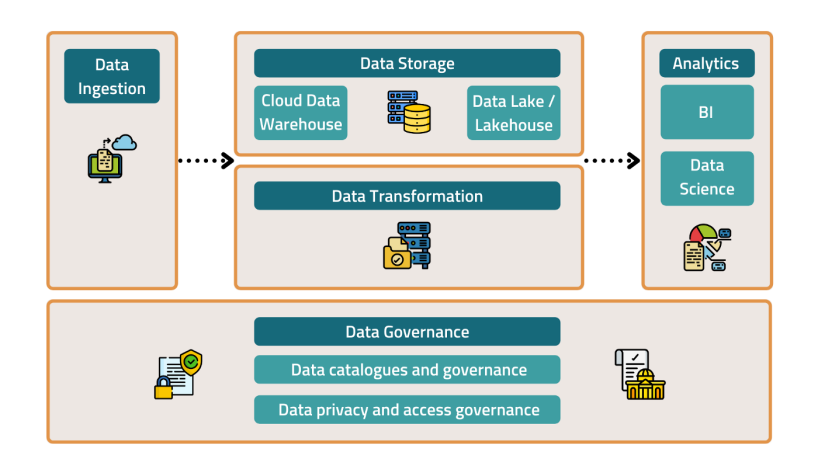
Here are the key components of a data stack to include when designing your own data infrastructure for your product:
- Data Ingestion
- Data Storage
- Data transformation
- Data Analytics
- Data Governance
1. Data ingestion
Data ingestion is the importing of data from one location to a new destination, such as a data warehouse or a data lake, for further storage and analysis.
Your first step in creating a modern data stack is identifying your data sources. Thanks to data ingestion tools, you will be able to import all your data in minutes.
Let’s say you’re running an e-commerce business, inquiries must be limited to the products you sell and their variations. You don't want hundreds of queries per day hitting your database because someone queried an item he doesn't even purchase. Rank and filter your products by customer group, SKU, or other filters and provide user-friendly access through a "Visit My Store" button so customers can easily retrieve their order history for sales made through your site.
Examples of tools: Improvado, Fivetran, Stitch, Airflow
⚙️Our list of top 16 data ingestion tools will help you choose the best one for your data stack⚙️
2. Data storage
With the rise of cloud-native applications and microservices, most businesses generate huge amounts of data that need to be stored and managed. It’s a challenging task for traditional relational databases, which were designed for structured data.
NoSQL databases are ideal for unstructured data, but they can be difficult to deploy at scale, especially in hybrid environments.
Cloud providers offer their own managed solutions to help with this step. For example, AWS offers a solution called Amazon Simple Storage Service (S3) for object storage. Google offers BigQuery as a part of Cloud Platform. Both services provide a low-latency platform for storing large volumes of data at scale.
Examples of tools: Snowflake, Databricks, AWS, GCP
3. Data transformation
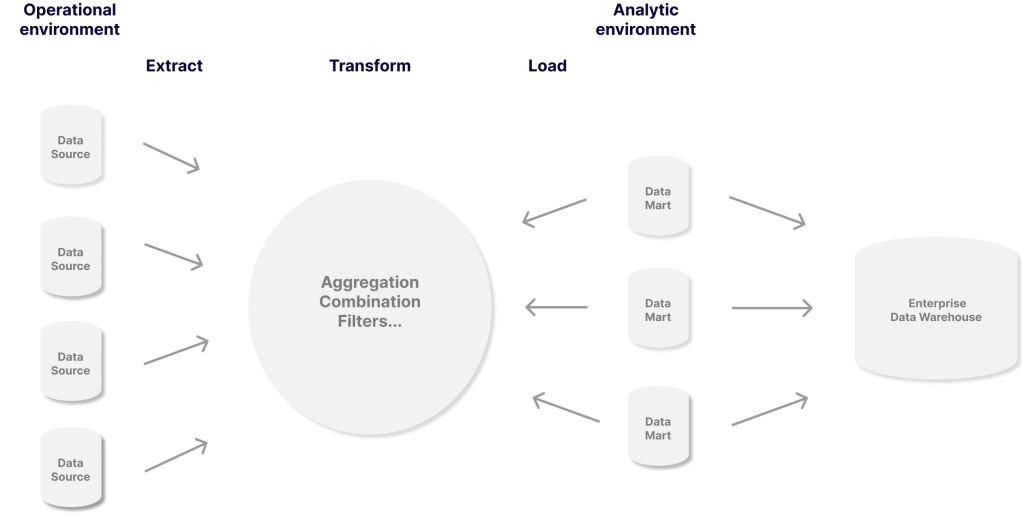
Data transformation is the process of converting data from one format or structure into another format or structure. Usually, data transformation is performed using extract, transform and load (ETL) techniques.
📖Learn how the ETL process accelerates manual data operations📖
Data transformation is crucial in the data integration process because it prepares and normalizes data for further analysis, reporting, and visualization. Data transformation can be performed on any type of dataset, regardless of its original format or designation.
Examples of tools: Improvado DataPrep, Dbt, MCDM, Matillon, Alteryx, RestApp
4. Data analytics
The analytics layer is responsible for aggregating, analyzing, and presenting the data to users. Your analytics layer should answer questions like:
- What are the key metrics for my business?
- How do those metrics change over time?
- How does one metric impact another?
Most of the time, this means your data will be transformed into graphs, charts, tables, and other visual representations that you can immediately comprehend.
Some recent data analytics platforms have capabilities that allow non-technical people to study data without knowing SQL.
Example tools: Looker, Tableau, Power BI
“Without big data analytics, companies are blind and deaf, wandering out onto the web like deer on a freeway.”
Geoffrey Moore, author, and consultant.
5. Data governance
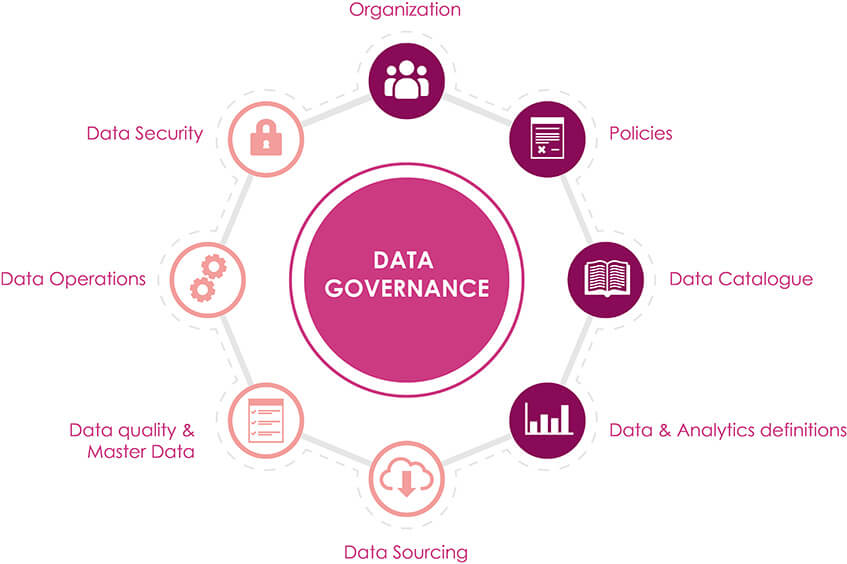
It's essential to ensure clear ownership and process for every step in the data pipeline. This includes setting standards for the types of data that are collected and how they're stored and accessed, along with processes to ensure that these standards are followed and enforced.
Suppose your goal is to use data to improve operational efficiency. You might decide that all of your inventory systems should use the same barcode system so that you can get a complete picture of your supply chain without having to reconcile different codes or systems manually.
Example tools: Atlan, Microsoft Azure Data Catalog, Informatica
Reverse ETL alternative
Many businesses have built their data stacks using ETL technologies. These technologies are useful for processing large amounts of data from multiple sources and moving it into a centralized data warehouse. However, this approach increases the complexity of your infrastructure and slows down the delivery time.
In today's world, business decisions are increasingly being made based on real-time data, whether it's in finance, supply chain management, or customer relationships. A modern data stack allows you to deliver real-time insights across the entire organization by keeping your data fresh, accessible, and secure.
This is where Reverse ETL can help you build a modern data stack that delivers real-time value to the business and eliminates the risk of failure due to outdated information.
Reverse ETL is a set of methods or processes that sync data from a data warehouse to operational tools like CRM, CMS, product, or any business tool (Slack, Google Sheet, etc.).
The idea behind this process is to create a single, comprehensive data source that provides a cohesive, trusted view of enterprise data. Reverse ETL processes are generally used to augment existing ETL processes, and they run at defined time intervals. Besides, Reverse ETL enables Operational Analytics.
Operational Analytics vs. Business Intelligence
Operational Analytics is the use of data, predictive analytics, and business intelligence tools to gain insight into business operations and to generate real-time actions thanks to activated data.
Business intelligence(BI) is defined by Investopedia as the procedural and technical infrastructure that collects, stores, and analyzes the data produced by a company’s activities.
Business Intelligence focuses on the analysis of historical data.
It helps you understand what happened and why. It is used to support business decision-making by identifying patterns and trends through data comparisons, benchmarks, and other statistical techniques.
For example, it makes sense to create a report that shows the number of orders placed in a particular time period, the average order value, and the total number of orders.
Operational analytics is a notion that is focused on real-time and the future. It focuses on what happens now and forecasting what will happen next so that it can assist in making the most of future chances.
To sum up, Operational Analytics shows where we need to act now, while Business Intelligence reveals what has been done wrong and what are the points for improvements.
Operational analytics is no longer limited to digital giants like Google, Facebook, and Netflix. Thanks to real-time data, any firm that uses a modern data stack make more data-driven decisions.
Organizational evolution is required
When a company implements a modern data stack, there are three major shifts in the way that data is managed:
A shift from From IT to business users
In the past, the IT department fielded requests for data from departments and analysts. The development of self-service analytics tools like Tableau and Looker has enabled business users to access and analyze data directly.
This shift has huge implications for how companies organize their resources around data.
From batch to real-time data processing
. As data pipelines become more streamlined and data becomes more accessible across the organization, the lag time between when an event happens and when it's analyzed needs to shrink.
This means that more companies are looking at real-time processing of their data rather than aggregating data over longer periods of time.
From siloed databases to federated ownership (Domains)
Traditional data architectures are built around siloed databases and federated ownership, which has led to the proliferation of data lakes, data marts, and data warehouses.
These architectures focused on centralized computations and storage infrastructure. As cloud services have matured and modernized, so should the approach to architecting data stacks.
Today’s data architectures must be able to handle the scale and complexity of modern applications that are distributed across a range of technologies. This is where the concept of a data mesh comes in — a new architecture that allows all types of data to be accessed securely governed easily, and consumed by any application anywhere.
Rely on your stakeholders
There are three main types of stakeholders when it comes to the modern data stack.
Internal stakeholders
These are the people within your organization who will be using data in their daily work.
For example, the sales team may be interested in how much revenue each customer brings in and how to increase that revenue. Or, maybe the marketing team is interested in what types of content drive the most website traffic.
The internal stakeholders should have a say in what data you gather, how you structure that data, and what tools you use to analyze it.
External stakeholders
These are the people from outside of your company, but they still have a stake in your success.
For example, if your business is a software as a service (SaaS) company, then users of your product are external stakeholders. If your business sells products online and ships them across the country or across the world, then customers and suppliers are external stakeholders.
It's important to understand what they need from you so you can deliver that data properly and efficiently.
Third-party stakeholders
These are people outside of your organization who also provide services to your company. For example, vendors that supply raw materials or IT consultants that help set up your technology infrastructure. If you want to avoid blind flies in terms of data, you need to master data analysis. This will increasingly require the development of data outside of your four walls.
Modern data stack strengthens the relationship between the company and its stakeholders with a more efficient share of data thanks to defined domains for each team and the ability to use it in a no-code environment.
Data domains strengthen the relationship between teams since they all operate in that same domain.
For example, a marketing team wants to know how many people sign up for their new product or service and how much revenue it generates after the signup. The data generated by the product team is relevant to the marketing team because they both work in a similar space.
Conclusion
As you can see, there are many things to consider when setting up your data stack. Given all of the different components involved, this is a big undertaking and it can be hard to get your arms around all of the moving parts.
Understanding why you need a data stack and how it will benefit your business enables you to plan for the long term by setting clear processes and timelines for implementation. The benefits of using a modern data stack are to outweigh any challenges along the way, not just in terms of individual projects and initiatives but also in terms of establishing a strong foundation that helps you make better decisions overall.
500+ data sources under one roof to drive business growth. 👇
.png)
 (1).png)
.png)

.png)


 (1).png)

.png)


.png)


.png)
.png)
