Are you struggling to organize your marketing metrics? Marketers usually find themselves scrambling to pull data from many different resources like Google Analytics, Facebook, Shopify, Salesforce, and others.
Understanding your marketing numbers and being able to properly track ROMI is key to not only optimizing campaigns but also justifying marketing spend and showing marketing influenced revenue. However, building your marketing analytics roadmap can be time-consuming. There are too many metrics, reports and repetitive tasks that could be streamlined.
In this post we provide an overview of the steps you can take now to build an efficient reporting structure.
Tour de headlines:
- What is marketing reporting?
- Who needs to create digital marketing reports?
- Why is reporting important in digital marketing?
- What should a digital marketing report include?
- How to create a digital marketing report?
- Main marketing metrics to include in a digital marketing report
- Diving into different types of digital marketing reports
- [Bonus] Sales KPIs report overview + template
- [Bonus] Paid marketing channel mix report + template
What is marketing reporting?
Marketing reporting is a process of collecting, organizing, analyzing, and visualizing your marketing data to understand how your efforts affect the company's bottom line. Then, this information can be used to guide future marketing initiatives and strategies. Comprehensive digital marketing reports uncover actionable insights that should be a foundation for your further actions and decisions.
Who needs to create digital marketing reports?
Every marketing team needs to compile reports to monitor the performance and impact of their activities.
Agencies use digital marketing reports to inform clients about their activities and successes. Internal teams draw up reports to demonstrate how their activities affect the company’s KPIs.
Depending on the size and the budget of the team, there might be marketing analysts and tools that focus exclusively on reporting. However, sometimes, regular marketers have to handle reports on their own, manually, which takes time and often leads to human mistakes rendering reports useless.
Why is reporting important in digital marketing?
So, it gets increasingly clear that digital marketing reporting is a critical aspect of all marketing efforts. But the ‘Why?’ behind it might still be a little bit obscure. Let’s look at the main reasons for companies to care about digital marketing reporting:
As seen, digital marketing reporting plays a crucial role in the success of your team’s effort. Digital marketing reports help businesses make informed decisions, optimize their campaigns, and ultimately drive business growth.
What should a digital marketing report include?
A good digital marketing report should include the following components:
- A list of all marketing activities you’ve done in a certain period of time
- Metrics that show how these activities performed and how they influenced the company’s bottom line.
- Findings and learnings you’ve extracted out of these metrics.
- A brief plan of the next activities you’re planning on.
We’ll discuss essential metrics for a digital marketing report further in the article, or you can read a complete guide on essential metrics for marketing reports.
How to create a digital marketing report
#1 Think About Your Audience
Marketing analytics and reports are not only meant to be reviewed by marketing teams. These metrics are essential to ensure alignment with the company’s goals and measuring the actual dollars of marketing success.
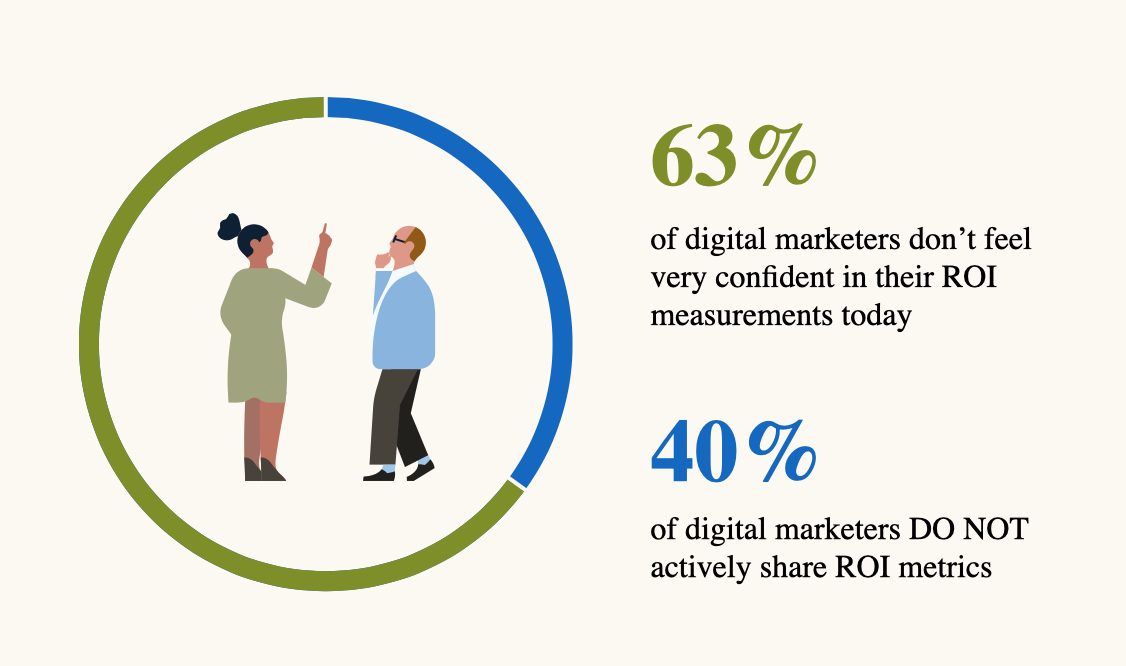
In fact, proving return on investment of their marketing activities was named as a big challenge facing marketers in a recent LinkedIn research. The report revealed that not everybody was sharing ROI metrics, but also that over two-thirds of the respondents don’t feel confident in their ROI measurements today.
Efficient reporting is not only helpful to optimize your campaigns or grow your business, but also to secure or increase your marketing budget.
Therefore, we’d recommend starting with your audience in mind. Consider how granular your audience likes to see data. Different stakeholders need different information.
Executive team reporting: How much revenue is marketing bringing in? Show the executive team and/or CEO revenue figures, business metrics versus marketing spend, from monthly progress review to year-over-year trends. In most cases, we would recommend using visuals and specific data points.
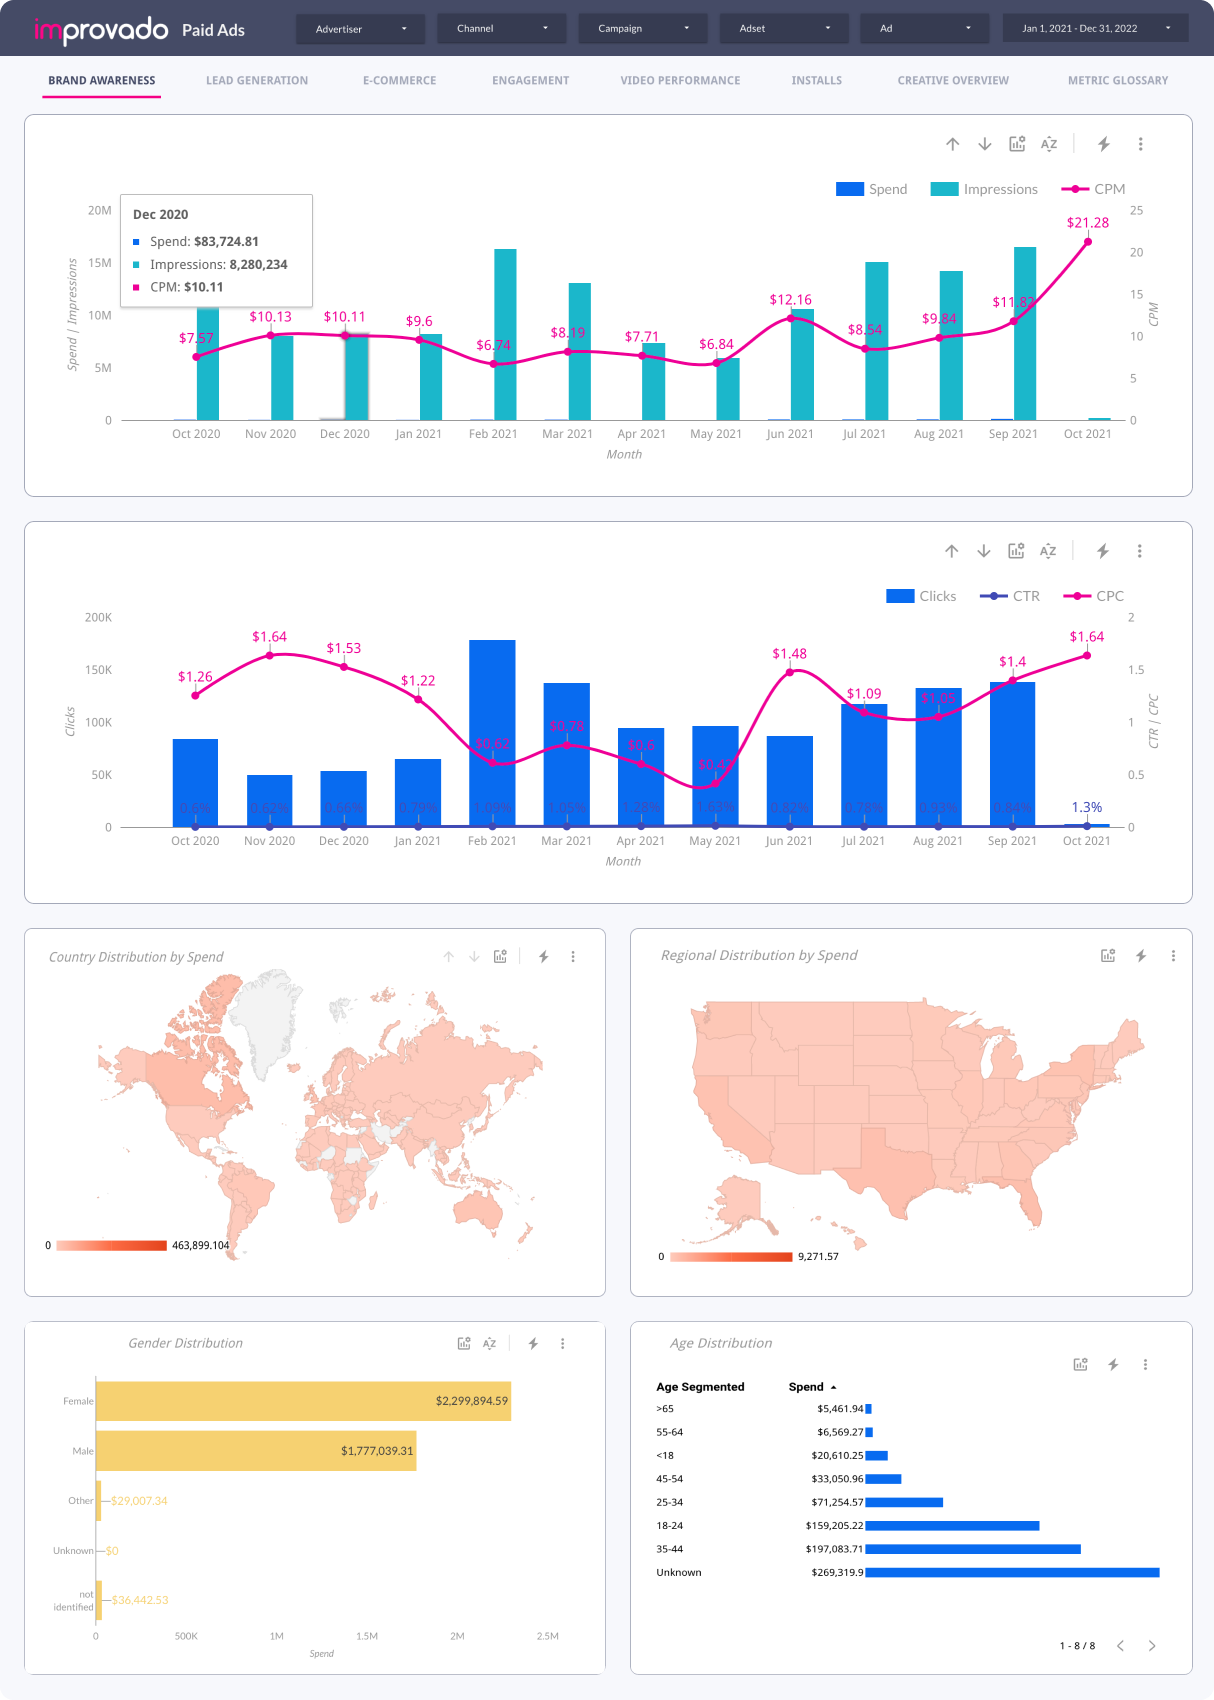
Marketing team reporting: Detailed reports by channel.For these reports, agreement on KPIs and metrics across teams and regions are key. Team members need to be able to compare apples to apples. These reports should give the marketing leadership team a full view of budget and allocation by channel, including performance and trends.If you are in charge of paid marketing or SEM for instance, measuring daily performance, CPC, CPA and impressions are definitely key to adjusting campaigns and improving ROI.
#2 Frequency of Reporting
The second step while building your marketing reporting structure is to think about how often you want to pull your reports, depending on what you are using them for.
- Monthly reports for executive team reviews. Also, depending on how regularly these reports might be needed, pulling these reports on a quarterly basis might be helpful. For executive or leadership teams, use fewer details and more visuals. Focus on business rather than performance metrics.
- Weekly check-ups for the marketing team. Whether you review these metrics and reports via email or during weekly meetings, having these stats available will help you monitor marketing performance and adjust if necessary to achieve your monthly and quarterly goals.
- Daily metrics for marketers working on a specific channel or tactic. These are crucial to optimize campaigns and monitor performance. E.g. daily reports of paid social campaigns.
#3 Marketing Metrics
There are a trillion metrics out there, and you will probably find many different articles suggesting what you should measure.
Depending on the type of business and industry that you operate in, you might want to set different KPIs, however, make sure you select the metrics that actually tell you what you want to know about your business.
When you are just getting started with marketing analytics and reporting, you would usually start with the basic metrics, to have a high-level overview of how the business is doing and how much you are spending by channel.
Some of the metrics that give you an insight into that are:
Traffic
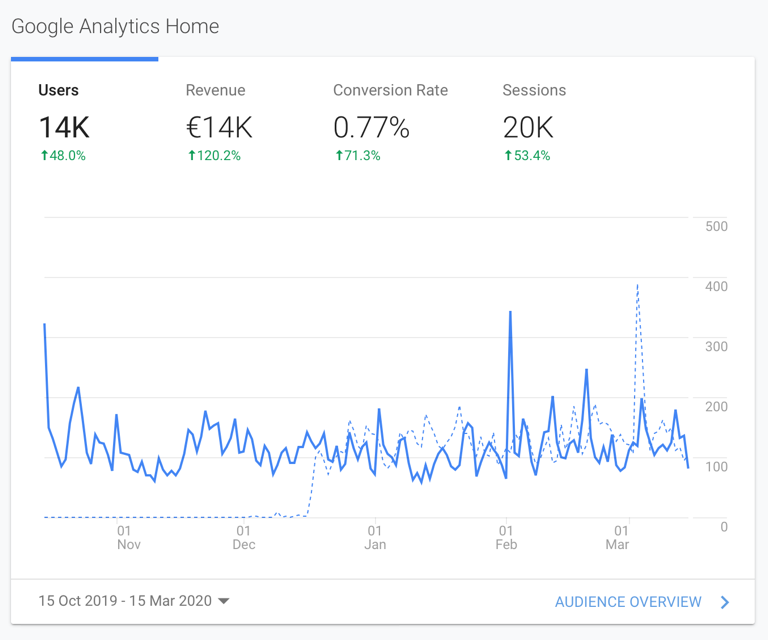
Unique visitors and page views. Although traffic numbers are important, you need to make sure your traffic grows along with conversion. You can pull this information directly from Google Analytics and check your weekly, daily and monthly growth.
Conversion Rate (CR)
The conversion rate shows the percentage of sessions that resulted in orders, out of the total number of sessions. You can see this on your Google Analytics dashboard, Shopify account, Magento, etc.
Revenue
Make sure your numbers are growing according to your marketing efforts. You can usually pull this data from your tool (Shopify, Magento, or other). A simple ROI estimation can be done by comparing revenue against marketing spend.
Log in to Google Analytics and the first thing you will see in your dashboard will be these metrics.
Bounce rate
If you are paying attention to your bounce rate, you are doing good. This metric shows the percentage of single-page sessions in which there was no interaction with the page, in other words, users who visit a single page on your website and leave right after that before taking any action. Having a high bounce rate (higher than 57%) is harmful, especially if you are investing in advertising. You can check the bounce rate by traffic source in Google Analytics.
The above metrics are great to have a quick overview of how the company is doing overall. But it doesn’t give you enough insight on how to actually make informed decisions, or how to improve sales, which areas of marketing can be improved and where you could potentially reduce cost.
Average Order Value (AOV)
In most cases you can see this information in your e-commerce tool. AOV shows the total value of all orders divided by the total number of orders.
($) AOV = ($) Revenue / (#) Number of orders
Customer Acquisition Cost (CAC)
CAC is calculated by comparing the total marketing spend versus the number of sales generated. For example, if you spend $20,000 a month on digital advertising and from those $20k you generate 2,000 sales, your monthly CAC from digital advertising would be $20.
($) CAC = ($) Marketing Spend / (#) Number of sales
CAC varies by industry and channel. A good way to benchmark your CAC is by comparing it to Customer Lifetime Value (also known as LTV).
Lifetime Value (LTV)
LTV shows how you will profit from your average customer during the time they remain a customer. LTV is calculated by multiplying the average number of purchases per customer and the AOV.
Purchase Frequency (PF)
Shopify store owners can find this data in their reports. You can also calculate this manually:
(#) Purchase Frequency (PF) = Total orders / Total customers
Once you have calculated the AOV and PF, you can estimate your LTV.
($) LTV = ($) AOV x (#) PF
LTV/CAC Ratio
The ratio of your customer lifetime value (CLV) to the cost of customer acquisition (CAC) is a very important metric, as it gives you a sense of your business' sustainability. You should be focused on finding ways to increase the ratio by increasing your CLV and/or decreasing your CAC. If the LTV/CAC ratio is less than 1.0 the company is destroying value, if the ratio is greater than 1.0 it may be creating value, but more analysis might be required.
Types of marketing reports
Some of the marketing reports you can pull by channel:
· Paid search (SEM)
· Paid social (Facebook, LinkedIn, TikTok, Pinterest, etc.)
· Retargeting (e.g. AdRoll)
· Google Analytics
· Programmatic (Google DBM or other)
· Affiliate (e.g. Awin)
· Amazon Advertising
· And more
The above reports on their own are helpful to have a general overview of the daily campaign performance by channel.
However, this marketing data is siloed across multiple channels. The more channels you use, the more siloed the information can get.
There are different ways to pull all that information together and have a holistic view of your marketing efforts. But the best way to do it is using a tool like Improvado that can instantly unify all your marketing data into any spreadsheet, BI tool, data warehouse or visualization tool of your choosing. Learn more and get a demo here.
In order to create operational reports, marketers can use Google Data Studio, Google Sheets or different templates to pull all the data together.
Below we list a couple of basic reports and templates that might be helpful to start with:
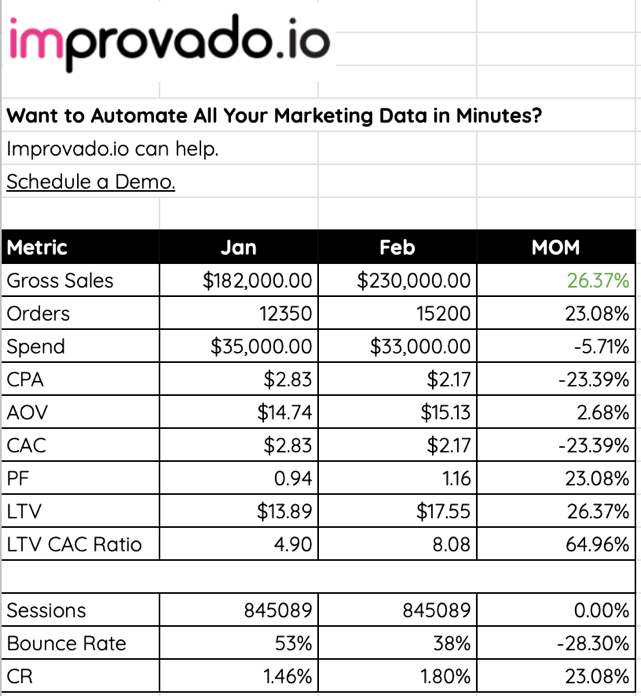
Sales KPIs Report Overview + Template
Objective: Have a snapshot of sales and marketing KPIs versus the same day the previous week, month or year.
Audience and frequency: Weekly for the marketing team or monthly or quarterly for the leadership team
Metrics:
- Revenue data from Shopify, Magento, Salesforce or any other tool you are using (gross sales, Orders).
- Spend and CPA (from the different marketing channels)
- Sessions and CR% from Google Analytics
Click here to access the template to have an overview of the KPIs and how you can estimate them by month. You can easily customize this sheet to have these metrics available daily or weekly.
Paid Marketing Channel Mix Report + Template
Objective: Understand ROI per channel
Frequency: Weekly
Audience: Marketing
Metrics:
- Clicks, impression, cost, CTR, CPC, Conversions: You should have these available from each advertising platform.
- Revenue: Using your revenue figures from your CRM or Shopify, Magento, etc. You can get these from Google Analytics (last-click attribution model)
- ROAS: This metric shows the revenue on ad spend, and the formula is simple (Revenue on Ad Spend / Ad Spend)
Click here to gain access to the template to have a very simple overview of how to structure your paid marketing mix.
Connecting the dots with Improvado
Most of us find it challenging to gather all this data and make all these manual updates. Processes can be extremely repetitive and time-consuming. Marketing teams should be focused on developing and executing a winning strategy instead of dealing with repetitive reporting tasks.
Our recommendation:
Check out The Best Facebook Ads Report Templates to Try
The Best Marketing Analytics Tools & Software for 2023
Best agency management software for marketing agencies
The Best Marketing Dashboard Software of 2023 and How to Set it Up
Marketing “Middleware” Demystified
Global Digital Advertising Spend by Industry in 2023
Learn about Best Dashboard Software
500+ data sources under one roof to drive business growth. 👇
Streamline marketing analytics to make smart decisions faster
.png)
 (1).png)
.png)

.png)
.jpeg)


 (1).png)

.png)


.png)


.png)
.png)
